
2026 Higher Education Marketing Benchmarks: Know Your Numbers, Grow Your Enrollment
May 21st, 2026 by
Note: This post was updated by Paula French on 5/21/26 to reflect current best practices. It was originally published on June 25th, 2024.
Key Insights
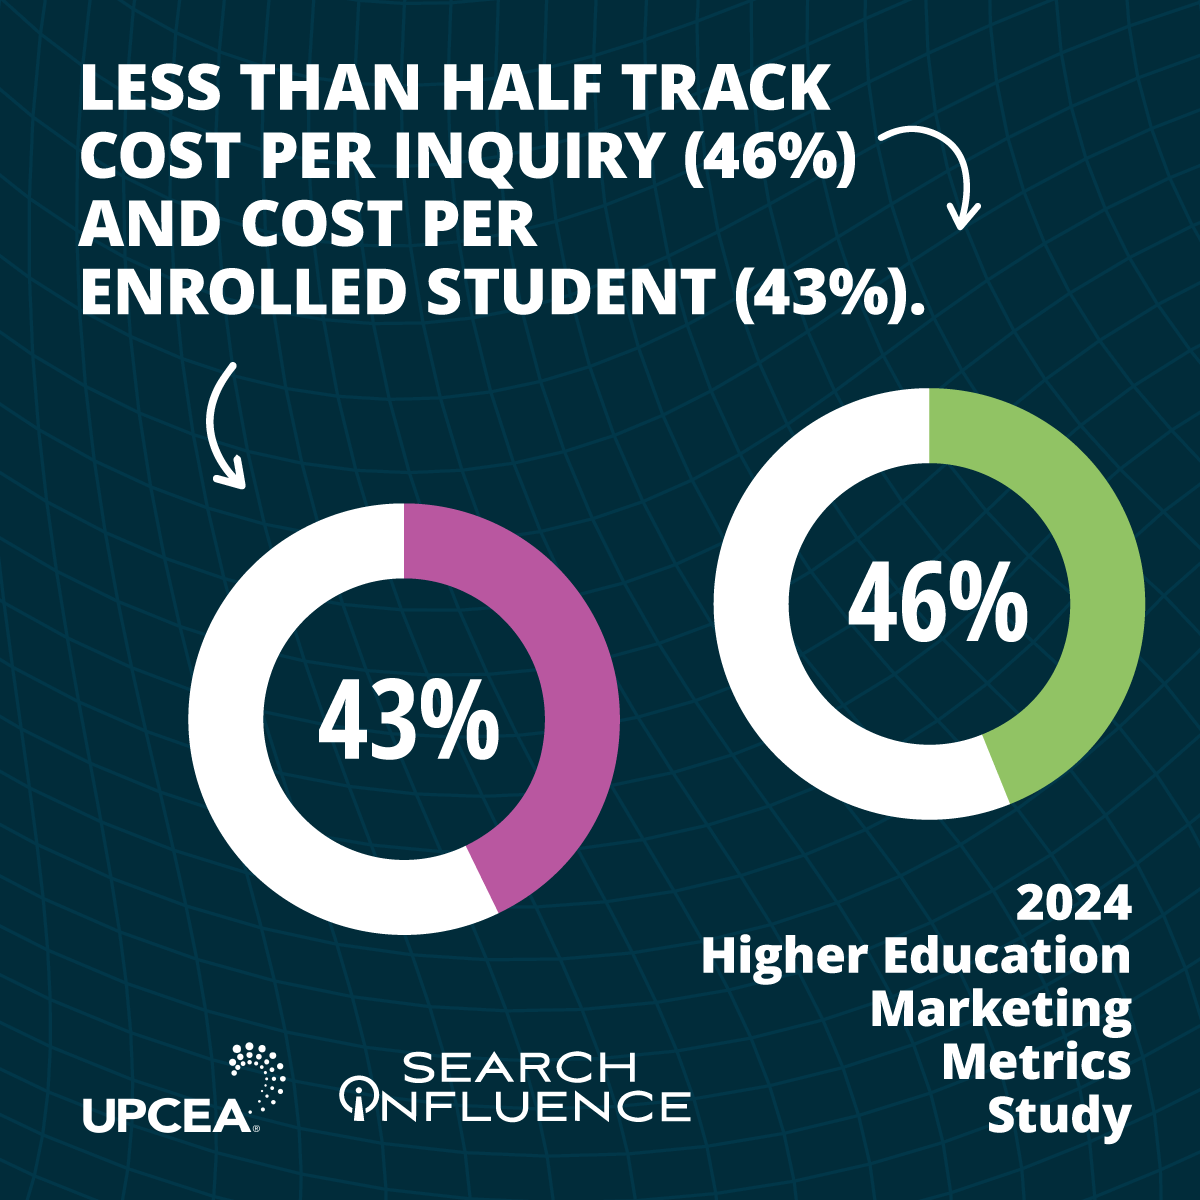
- Fewer than half of PCO units track cost per inquiry (46%) or cost per enrolled student (43%), despite spending nearly $900k annually on digital advertising.
- The average cost per inquiry is $140; the median is $106.
- 50% of prospective students use AI tools at least weekly; 56% say AI citations influence which institutions they trust.
- Education shows a 10.05% conversion rate on Meta lead campaigns, one of the strongest of any industry.
- Marketers satisfied with their tracking are significantly more likely to be satisfied with their results.
Changing demographics, limited resources, and increased competition are reshaping higher education marketing.
The institutions that adapt fastest share one thing in common: they know their numbers.
Not just where inquiries come from, but what each one costs, and whether their programs are visible where today’s students are actually looking.
This post covers three benchmark areas every higher ed marketer should be tracking in 2026.
Benchmark 1: Cost Per Inquiry, Enrollment, and Marketing Operations
In What Gets Measured Gets Managed, our 2024 higher education marketing benchmark research conducted in partnership with UPCEA, we analyzed whether professional, continuing, and online (PCO) units are tracking two key metrics that inform critical outcomes: cost per inquiry (CPI) and cost per enrollment.
The findings reveal a significant gap between what institutions spend and what they measure.
Digital Ad Spend (2024)
The modern learner has gone digital, and the higher education marketing sector rightfully followed suit.
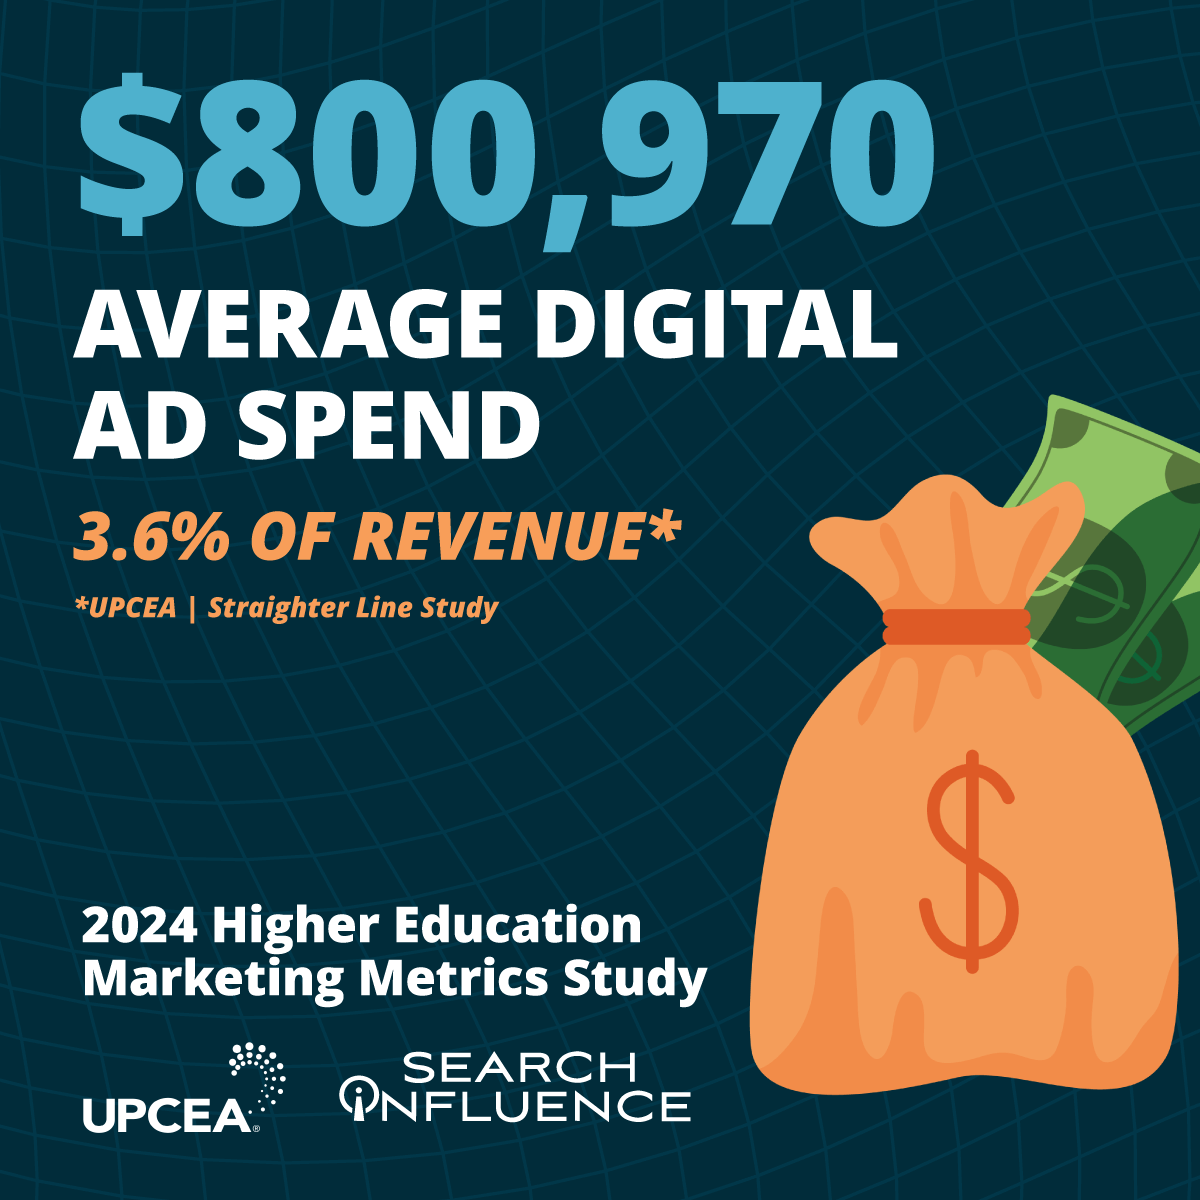
- Professional and online education units spend an average of $800,970 per year on digital advertising, including paid search, social advertising, and connected TV (CTV) streaming ads.
As the new learner searches for higher education programs online, digital advertisers must meet inquirers where they are in their enrollment journey.
This involves continuous learning, adapting, testing, and re-testing — a process that starts with tracking the right campaign data, like cost per inquiry.
What good looks like: $800,970 is a significant investment. Without tracking CPI and cost per enrollment at the program level, there’s no way to know which portion of that spend is working and which isn’t.
Cost per Inquiry (2024)
Cost per inquiry (CPI) is the most important metric for understanding what it actually costs to drive a prospective student to take action. CPI is straightforward to calculate: divide your total marketing spend by the number of inquiries received, most commonly through RFI forms, brochure requests, and visit request forms.
Yet most institutions aren’t tracking cost per inquiry.
According to our 2024 university marketing metrics research:
- Nearly three-quarters (73%) of marketing units track where inquiries come from, but less than half (46%) track what each inquiry costs.
- For nearly one in five (17%), metric tracking isn’t on their radar at all.
- Of the 46% that do track CPI, the average is $140, with a median of $106.
- Roughly one-third (32%) have a CPI between $50–$100, 15% between $101–$150, and 15% over $200.
- The costs most often include media spend (88%), marketing expenses excluding salaries (46%), and agency management fees (39%).
What good looks like: A CPI at or below the $106 median puts you in the top half of PCO institutions. More importantly, watch your trend line. If CPI is rising while inquiry volume stays flat, it’s time to review your channel mix or creative performance.
For a closer look at what separates a high-quality inquiry from a low-quality one, see our guide on how to measure lead quality.
Cost Per Enrolled Student (2024)
Cost per enrolled student is the total marketing investment divided by the number of students who actually enroll, giving you the most definitive measure of your true marketing return. It encompasses every dollar invested from campaign launch to matriculation, including media spend, agency management fees, university marketing team salaries, and all other marketing undertakings. Unlike cost per inquiry, which only measures the cost of generating interest, cost per enrolled student captures what it costs to convert that interest into an actual student.
Our findings from 2024:
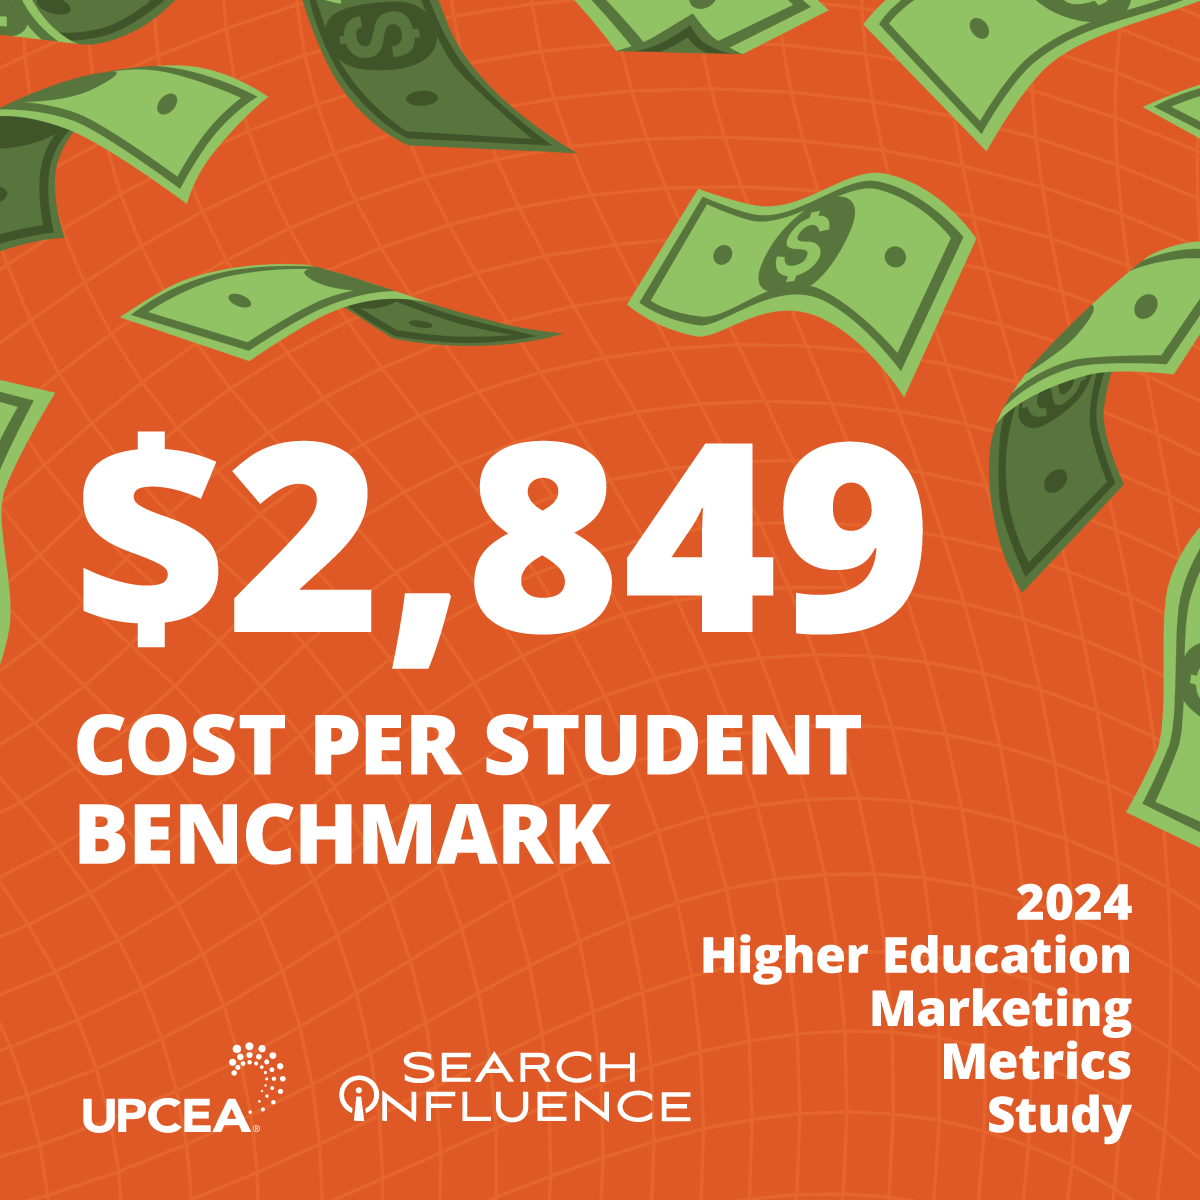
- Among PCO units that track cost per enrolled student, the average is $2,849, with a median of $1,173.
- 27% came in under $500; 27% exceeded $3,000.
- Only 38% of respondents reported being satisfied with their results, and 27% weren’t sure.
Leveraging cost per inquiry and cost per enrollment in tandem gives you visibility into the full funnel, not just where leads come from, but what it takes to turn them into enrolled students. When you analyze these numbers over time or across programs, patterns emerge that point directly to where budget, resource allocation, or strategy needs to change.
What good looks like: Because cost per enrollment varies significantly by program type, institution size, and market, focus on your own trend. If cost per enrollment is climbing without a corresponding lift in enrollment volume, that’s your signal to investigate.
Not sure how to calculate your numbers? Use our CPI Calculator or download our free worksheet to get started.
In-House vs. Outsourced Marketing (2024)
- Nearly three-quarters (73%) of higher ed email marketing and half of SEO efforts (44%) are entirely managed in-house.
- Half of survey respondents exclusively outsource their Google paid search campaigns to experienced agencies.
Most PCO units mix and match what is outsourced and what is managed in-house. Managing campaigns internally requires universities to have the time, skills, and resources to monitor performance and stay current on trends.
What good looks like: There’s no universal right answer. The best approach depends on your team’s capacity and expertise. If your in-house team is stretched thin or lacking specialized skills, outsourcing digital advertising to an agency can free up resources and improve results. Not sure where to start? Take our In-House vs Outsourced Quiz today.
Tracking and Marketing Satisfaction (2024)
Tracking campaign performance has a direct link to overall marketing satisfaction.
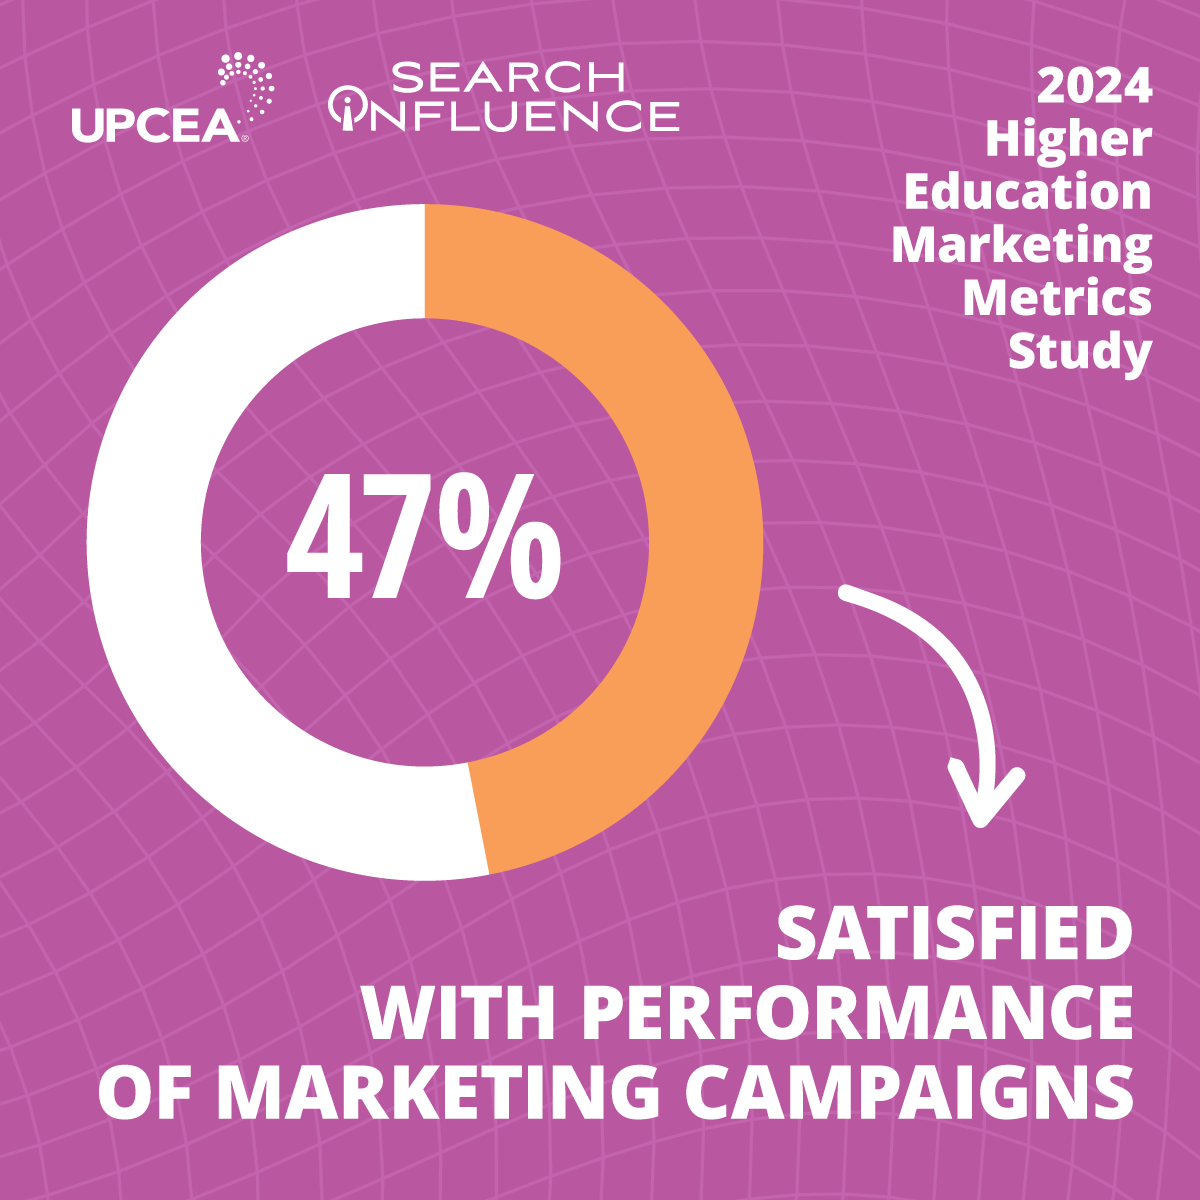
- Fewer than half (46%) of survey respondents report satisfaction with their campaign’s performance.
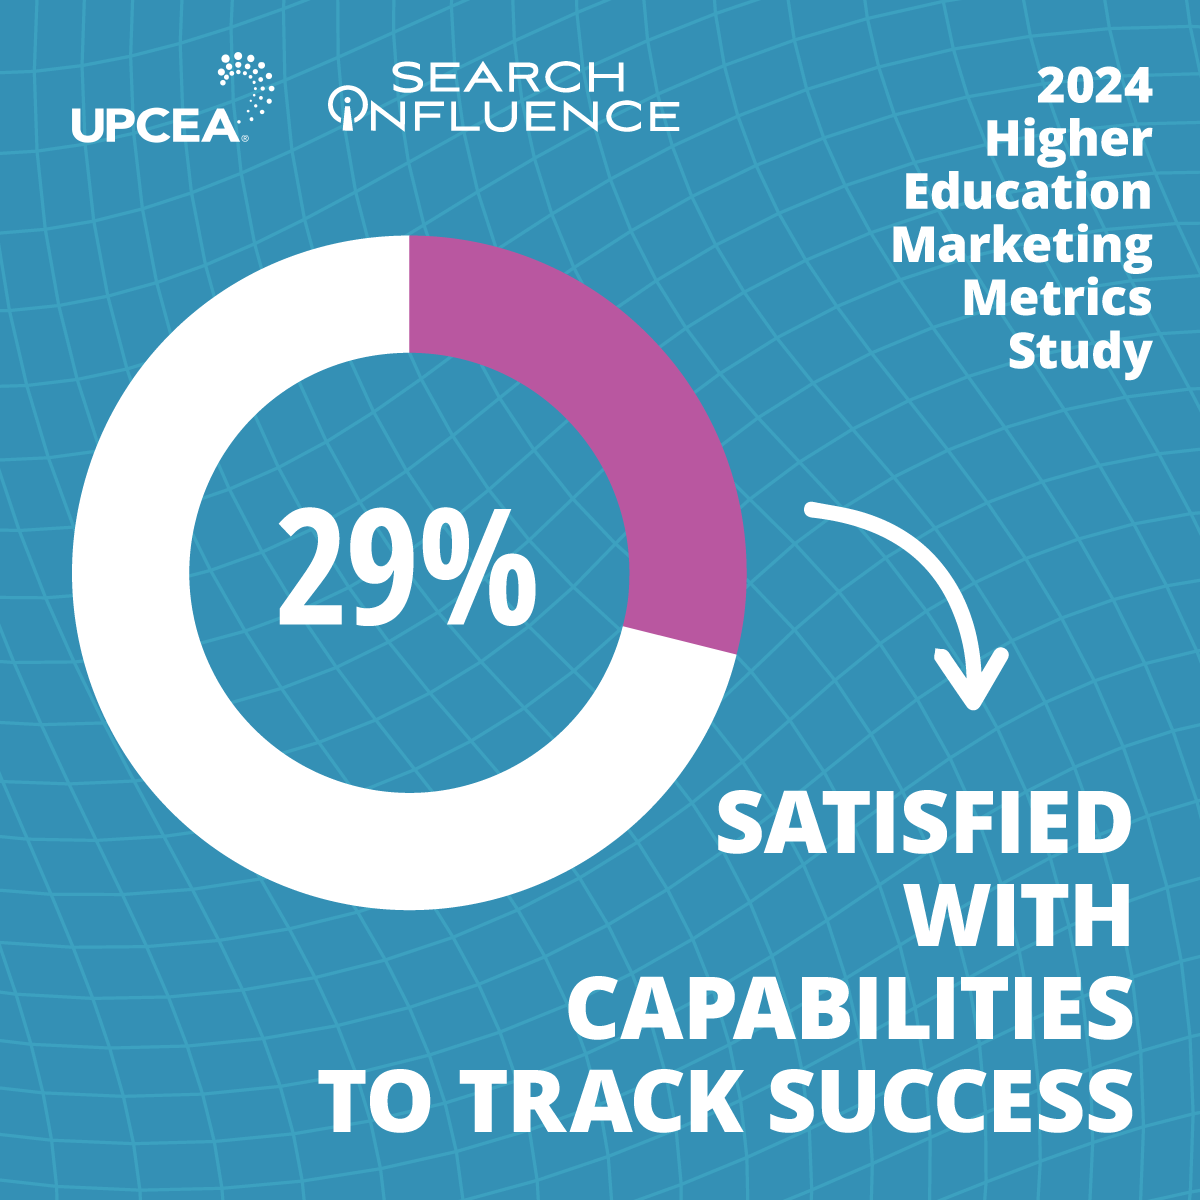
- Only 29% are satisfied with their ability to track success.
- Those satisfied with their back-end tracking capabilities are significantly more likely to be satisfied with how campaigns perform overall.
Without visibility into what’s working, institutions fall into a cycle of campaign launch → result dissatisfaction → repeat, with no data to guide improvement.
What good looks like: If you’re in the 71% who aren’t satisfied with your tracking capabilities, that’s the first thing to fix. Better measurement is the foundation on which everything else is built. For a deeper look at building that foundation, see our guide on higher ed marketing analytics reporting.
Want the full picture? Download the complete 2024 higher education marketing metrics research study to see all the data behind these findings.
Benchmark 2: AI Search Visibility
CPI and cost per enrollment tell you what you’re spending to win a student. But they can’t tell you whether your institution is visible in the moments that shape a prospective student’s consideration set long before they fill out a form. That’s where AI search comes in, and the gap between student behavior and institutional readiness is significant.
To understand the scope of this shift, UPCEA and Search Influence conducted the 2025 AI Search in Higher Education Research Study, surveying 760 qualified adult learners aged 18 to 60 who are actively interested in professional and continuing education.
Student AI Search Behavior
- 50% of prospective students use AI tools at least weekly.
- 79% read Google’s AI-generated overviews when they appear in search results.
- 56% say they are more likely to trust institutions cited in AI-generated responses.
- 84% of prospects use traditional search engines, 61% use YouTube as a search engine, and 50% rely on AI tools in the same way they use Google.
- 82% are more likely to consider programs that appear on the first page of search results.
Half of your prospective audience is using AI tools weekly, and more than half say being cited in AI results influences their trust in an institution. If your programs aren’t appearing in AI-generated responses, you’re absent from a meaningful portion of the research process before a student ever reaches your website.
University/Institutional Readiness
Students have moved. Most institutions haven’t kept pace. An UPCEA snap poll of 30 member institutions found that 60% are in the early stages of exploring how to adapt to AI search, just 30% have a formal strategy in place, and the remaining 10% haven’t started or don’t expect AI to impact student discovery at all.
The risk of waiting is compounding. AI models learn from the institutions already visible, which means early movers build credibility with AI systems over time while those on the sidelines fall further behind.
What good looks like: Formal citation rate benchmarks for higher ed AI search don’t yet exist. This is genuinely new territory. There are two ways to start tracking your presence:
- Option 1 — Manual Spot-Checking: Query ChatGPT, Perplexity, and Google’s AI Overviews for your top programs and note whether your institution appears in each. If it doesn’t, that’s your baseline. From there, aim for consistent citation across three to five core program queries.
- Option 2 — AI Visibility Tracker: Use a dedicated AI Visibility Tracker to systematically monitor your presence and citations across AI platforms over time. Search Influence puts this in place for clients to track citation accuracy and surface gaps as AI search behavior evolves.
For the full data and recommendations, the 2025 AI Search in Higher Education Research Study is available to download.
Benchmark 3: Channel Performance — Paid Search, Social, CTV, and Email
Knowing your CPI and understanding your AI search visibility gives you a strong foundation. However, those numbers don’t exist in isolation. They’re downstream of how well each individual channel is performing.
Here’s how the channels PCO units rely on most stack up against those benchmarks.
Google Paid Search
Paid search is where most PCO units direct the largest share of their digital budget, and for good reason. High-intent queries from prospective students actively researching programs convert at some of the strongest rates in digital advertising.
Education and instruction is one of the most expensive categories on Google, and one of the best-converting. According to WordStream’s 2025 Google Ads Benchmarks, which analyzed over 16,000 U.S.-based campaigns:
- Average CPC for education and instruction: $6.23 — among the highest of any industry, reflecting intense competition for enrollment-ready searches
- Average CTR for education: ~5.74%
- Average conversion rate for education: 11.38% — the largest year-over-year improvement of any industry (+43.87%)
- Average cost per lead for education: ~$90.02
- Cross-industry average CPC: $5.26; average CPL: $70.11
What good looks like: A CPC above the cross-industry average is expected in education and acceptable, provided your conversion rate is keeping pace. The 2025 data shows that institutions getting the most from paid search are paying more per click but converting at higher rates, which brings CPL down over time. If your CPL is climbing without a corresponding improvement in conversion rate, that’s the lever to pull first.
Meta (Facebook & Instagram)
Meta remains the dominant social platform for higher ed lead generation. According to WordStream’s 2025 Facebook Ads Benchmarks, which analyzed over 1,000 campaigns, education shows a conversion rate of 10.05% for lead campaigns (one of the strongest of any industry), reflecting how well intent-based program audiences respond to targeted creative.
- Average CPC (lead campaigns): $1.92 across industries
- Average cost per lead: ~$27.66
- Average CTR (traffic campaigns): ~1.57% across industries
What good looks like: A cost per lead meaningfully below $27.66, paired with a strong inquiry-to-enrollment rate downstream, is the target. Meta rewards relevance. Ads aligned to specific programs and audience life stages consistently outperform broad institutional branding.
TikTok
TikTok has emerged as a viable reach-building channel for higher ed, particularly for programs targeting the 25–34 demographic, now the platform’s largest ad audience. CPMs remain lower than Meta’s, making it efficient for top-of-funnel awareness. According to WebFX’s 2026 TikTok benchmarks and AdLibrary’s industry CTR data, education and EdTech brands see a CTR of approximately 0.89%, slightly above the platform-wide average.
- Average CTR: ~0.84% overall; education/EdTech: ~0.89%
- Average CPC: $0.50–$1.00
- Average CPM: ~$9–$13 (Triple Whale, 2025)
What good looks like: TikTok works best as an awareness and remarketing layer rather than a primary lead channel. A CTR consistently above 1% signals strong creative resonance. Plan for a longer attribution window and lower direct conversion rates than you’d see on Meta or paid search.
LinkedIn commands the highest CPMs of any social platform, but earns consideration for graduate and professional education programs where career context sharpens audience fit. According to Coupler.io’s 2025 PPC benchmarks and the 2026 Social Media Advertising Platform Guide:
- Average CPC: ~$5.58
- Average CTR: 0.63–0.65% for professional audiences
- CPMs: $33–$65 for typical professional targeting
What good looks like: Use LinkedIn selectively for MBA, executive education, and professional certification programs. Lead volume will be lower than Meta, but lead quality is often meaningfully higher, making it worth evaluating on cost per qualified inquiry rather than cost per lead alone.
Connected TV
CTV already appears in how PCO units allocate their $800k+ digital budgets (see above), and the channel is growing fast. According to SEO Design Chicago’s 2025 CTV advertising guide, U.S. CTV ad spend reached an estimated $32.57 billion in 2025 (a 16% year-over-year increase) as streaming continues to displace traditional television viewing. For higher ed, CTV offers something paid search and social can’t: full-screen, non-skippable brand presence in a lean-back environment.
- Average CPM: $20–$40, depending on targeting precision and inventory quality (Adwave)
- Video completion rate: 90–98% — compared to 40–60% for standard digital video
- Brand recall: CTV ads drive 20% higher brand recall than mobile video (Marketing LTB)
What good looks like: CTV is primarily a brand awareness channel. Don’t evaluate it against the same direct-response metrics you’d apply to paid search or Meta lead campaigns. The right benchmarks are completion rate (aim for 90%+), reach against your target audience, and downstream lift in branded search volume or direct traffic following a campaign flight.
Email remains one of the most in-house-managed channels in higher ed and one of the most cost-efficient when executed well. Education consistently ranks among the top industries for email engagement, according to OwlClaw’s 2025 email marketing benchmarks.
- Education sector open rate: ~35.5% (note that Apple Mail Privacy Protection inflates open rates by 10–15 points for many senders. Click-to-open rate is now a more reliable signal.)
- Average CTR for education: ~3.00% (The Email Marketers, 2025)
- Click-to-open rate (CTOR) target: 10–15% is considered healthy across industries
- Unsubscribe rate for higher education: ~0.1% (MailerLite, 2025)
What good looks like: An open rate above 25% and a CTR above 3% puts your email program in solid territory for education. Prioritize CTOR as your primary engagement metric and downstream conversion (form submissions, RFIs) as your north star. Automated, behavior-triggered sequences consistently outperform broadcast campaigns and are worth investing in even when email is managed entirely in-house.
Gain Insights Into Your Higher Ed Marketing Performance With Search Influence
The bottom line: The right benchmarks are how institutions stop guessing and start improving. CPI and cost per enrollment tell you how efficiently you’re converting spend into students. AI search visibility tells you whether you’re present before students ever reach a form. And channel benchmarks tell you whether your execution is competitive or leaving results behind.
These metrics work together. The institutions that win enrollment in the years ahead are those that measure across all of them.
Ready to go deeper? Explore Search Influence’s higher education services, or check out our 90+ higher education marketing statistics for more data to inform your strategy.