
The Most Important Facebook Ad Metrics for Achieving Your Goals
March 20th, 2020 by
By now, most marketers buy into the idea that they need to advertise on Facebook and Instagram, but how do they know if those ads work? Enter about a million metrics to analyze.
That’s only a fraction of what is available, and yes, it can get overwhelming pretty quickly. The first step to figuring out which Facebook Ad metrics you need to monitor is figuring out your goals. Campaign goals usually break down to these four categories:
- Increasing brand awareness
- Driving traffic to your website
- Generating leads
- Generating sales
Let’s look at these and determine what your primary KPIs (key performance indicators) should be for each goal, as well as some secondary KPIs to watch.
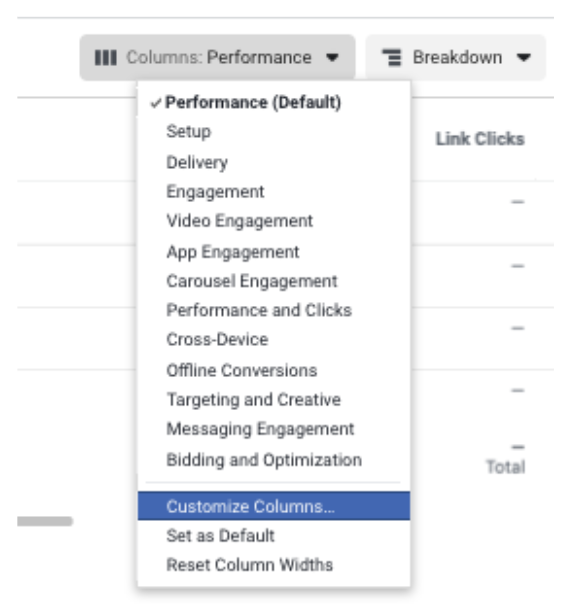
To see some of these metrics, you’ll need to customize your columns. Some of these are not included in the preset table views. Select Customize Columns from the Columns dropdown menu.
Increase Brand Awareness
When increasing brand awareness is your goal, you’ll probably want to show your ads to as many people within your target audience as possible. You’ll also want to show them those ads enough times to make an impression, but not so much that you drive them crazy.
Brand awareness campaigns are a necessary and often undervalued piece of the marketing funnel. Their impact is notoriously difficult to measure, which means people often overlook their importance. Think about it; you can’t exactly put a number to how “top of mind” your brand is to your audience.
Primary KPI
Estimated Ad Recall Lift
Estimated Ad Recall Lift (EARL) is a tricky metric because it doesn’t measure an action, which is what most other Primary KPIs will measure. Estimated Ad Recall Lift (People) is an “estimate of the number of additional people who may remember seeing your ads, if asked, within two days.”
Secondary KPIs
Estimated Ad Recall Lift Rate, Cost per Estimated Ad Recall Lift
These are calculated based on the Estimated Ad Recall Lift metric. The rate is found by dividing the EARL by the Reach. The cost is found by dividing the Amount Spent by the EARL.
Since EARL isn’t an action, it doesn’t tell us if the campaigns are “working,” but looking at the rate and cost does help us understand which creative is resonating for the audience and is best used as an indicator when optimizing campaigns. For example, when reviewing ad copy, the ads with the highest Estimated Ad Recall Lift Rate are the ones most likely to be remembered by a user.
Drive Traffic to Your Site
If your main goal is to get people to click through your ad and to your site, you might think clicks would be the primary KPI, but you would be wrong. Firstly, Facebook has several click metrics that can confuse newbies.
The Clicks (All) metric measures ANY click on your ad. So if someone clicks the page name to go to your Facebook page or likes the post, that all gets counted. Link clicks are only counting clicks on your link. This link could be in the text description or the CTA button. Even this isn’t the main metric you want to watch, though.
Primary KPI
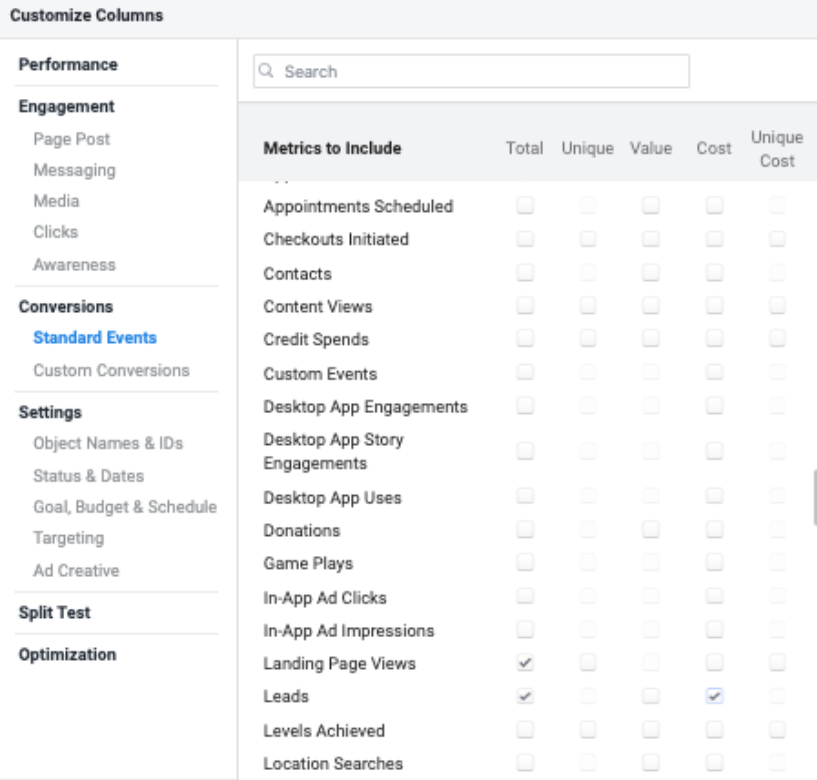
Landing Page Views
While clicks on your ad are good (and necessary to get users to your site), what you really need to be reporting on is landing page views. A landing page view is counted when someone clicks the ad and then “successfully loads the destination webpage or Instant Experience.”
Secondary KPIs
Link Clicks
While you don’t want to focus too much on link clicks, you do want to monitor the delta between link clicks and landing page views. If you are getting a lot of clicks and a drastically lower number of landing page views, your site might be too slow. When people lose patience with a slow loading page, they bounce.
Cost Per Landing Page View
When looking at creative or targeting performance, the cost per landing page view can help you optimize for efficiency.
Click-Through Rate
The CTR is the percentage of impressions that resulted in a click and is often a measure of your ads’ effectiveness. A high CTR is an indication that your ad is resonating with your audience. This measurement doesn’t necessarily mean that it’s a “good” ad; it just means it’s a good ad for that audience. Your top CTR ad for an audience of women over 40 in Manhattan might not perform as well with an audience of millennials in Los Angeles, even if the offer appeals to both.
Generate Leads
This one is pretty obvious…
Primary KPI
Leads
If your goal is leads, make sure you have your pixel set up to track your calls, form fills, and other conversions. Hopefully, you’re already using the Facebook Pixel to track the success of your campaigns. This tool is a must for any campaign with a goal that occurs off of Facebook (leads, app downloads, sales, etc.)
Secondary KPIs
Cost Per Lead
The only thing better than a lead is a cheap lead. Watch the CPL to monitor effectiveness.
Generate Sales
You would think the first thing you look at is sales, but what you really need to focus on is your return.
Primary KPI
Return on Ad Spend
Your ROAS is a simple little formula—Revenue/Ad Spend—but it’s a big deal. Ten transactions for a $50 item is probably worth more to your business than 15 transactions for a $20 item. But if you spend $5,000 to get those ten transactions and only $100 to get those 15 transactions, you’re looking at 10% ROAS compared to 300% ROAS. Looking at the number of transactions or revenue alone does not give you the full picture. ROAS does.
Secondary KPI
Transactions and Revenue
Though these don’t provide the same context as ROAS, they are still significant and should be monitored along with transaction rate (transactions/clicks) and average order value (revenue/transactions).
Bonus KPI to Watch
Frequency
This indicator is the average number of times each person saw your ad. It is calculated by dividing the number of impressions by reach. It’s essential to monitor your ad frequency to make sure you are hitting the sweet spot between the audience not noticing your ad and users screaming if they have to look at it again. We’ve all experienced an ad that follows us around the Internet or shows up every time we log into Instagram.
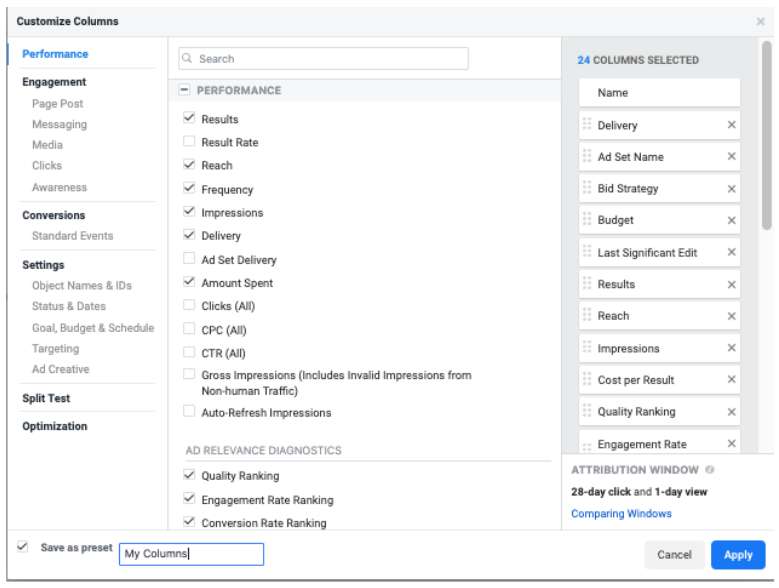
You’ll usually want people to see your ads more than once, but ad fatigue is real. People will start ignoring your ads entirely if they have seen them too many times. It might be a good idea to plot frequency along with your primary KPI to see how your rate affects performance. This Adspresso blog explores frequency’s effect on CTR and CPC. One last tip: once you figure out the KPIs you need to track, you can save your columns by checking the box at the bottom left of the Customize Columns box.
By the way, if you’re wondering if there are a different set of metrics you need to monitor for your Google campaigns, we can help you sort through the metric options in Google Ads too. At Search Influence, we’ve helped businesses across the country improve their digital advertising campaigns. To take the performance of your ads to the next level, contact one of our strategists today.
Images:
Laptop