What Your Marketing Dashboard Isn’t Showing You, And How Ours Does
September 29th, 2025 by

Key Insights
- Most dashboards miss critical context. Standard marketing analytics dashboards typically show surface-level numbers like impressions or clicks, but fail to connect them to real business outcomes like inquiries, acquisitions, or revenue generated.
- Search Influence marketing dashboards integrate multiple platforms. By pulling from CRMs, call tracking, Google Analytics, Google Ads, and even offline sources, our digital marketing dashboard examples provide a single source of truth for marketing performance.
- Lead quality matters as much as lead quantity. Search Influence’s marketing dashboards go beyond counting form fills by integrating qualified lead scoring and call tracking data, helping marketing teams focus on the channels most likely to drive conversions.
- SMART goals make marketing dashboards actionable. Unlike generic marketing dashboard templates, we build dashboards that align directly to Specific, Measurable, Achievable, Relevant, and Time-bound goals, keeping marketing teams focused on progress toward shared objectives.
- Customization is the ultimate advantage. Search Influence creates customizable dashboards tailored to your business model, ensuring your key marketing metrics tell your story, not someone else’s.
Imagine looking at your business through a foggy window.
You can make out some shapes, maybe website traffic here, some social media metrics there, but you’re missing the sharp details that let you make smart decisions.
That’s how most marketing dashboards work.
They give you a handful of numbers, but without context, connections, or clarity. They leave digital marketers staring at charts that raise more questions than they answer.
So what’s the solution?
At Search Influence, we think a marketing dashboard should do more than just decorate your monthly report. It should tie together multiple platforms, align with your marketing objectives, and give you actionable insights you can use to improve campaigns in real time.
Even our “standard” dashboards are built to outperform most marketing dashboard examples you’ll see from other agencies.
And when you need something truly unique? We scope and create custom dashboards that match your business model.
Here are six key points your dashboard probably doesn’t show you, and how ours does.
1. Leads From All Sources in One Place
The Problem: Standard digital marketing dashboards usually spotlight one channel: Google Ads, Facebook Ads, or maybe website form fills. But leads don’t live in silos.
The SI Difference: We integrate CRM systems, call tracking tools like CallRail, and web forms into one unified lead generation dashboard. Instead of bouncing between platforms, you get a single web analytics dashboard that tracks inquiries, lead generation efforts, and revenue-driving conversions.
The Benefit: You see the full story of your marketing efforts without the guesswork. One login, one source of truth, and one number you can trust.
2. Cost Per Inquiry (CPI) and Cost Per Acquisition (CPA)
The Problem: Many marketing analytics dashboards stop at cost per lead (CPL). But CPL doesn’t tell you whether those leads turn into paying customers.
The SI Difference: Wherever your CRM and analytics dashboard data allow, we go deeper. We create dashboards that can connect your marketing spend with inquiries and acquisitions, creating a real picture of ROI. Even when we can’t attribute it down to the channel, we show overall CPI and CPA so you understand the cost of growth.
The Benefit: You make data-driven decisions based on revenue potential, not just click costs.
3. Lead Quality, Not Just Quantity
The Problem: A thousand form fills don’t mean much if they’re all spam or unqualified leads.
The SI Difference: We work with clients to score lead quality. CallRail, for example, allows calls to be tagged and scored. We pull that data into your marketing performance dashboard so you know which channels bring in prospects most likely to convert.
The Benefit: You stop wasting budget on low-quality leads and double down on marketing channels that actually drive growth.
4. Multi-Source Data Integration
The Problem: Your marketing data lives in silos — Google Analytics, social media dashboards, CRMs, email campaign platforms, and more.
The SI Difference: We merge it all into a single digital marketing dashboard. From SEO dashboards that pull in Google Search Console and keyword rankings, to email marketing dashboards that show open rates and conversions, to paid advertising performance across Google Ads and LinkedIn Ads, everything comes together in one place.
The Benefit: You see how each channel supports your marketing strategy, without drowning in complex data.
5. SMART Goal Alignment and Progress Tracking
The Problem: Many dashboards are just a random collection of numbers. They don’t tell you whether you’re meeting your marketing objectives or hitting key metrics.
The SI Difference: We build dashboards around SMART goals — Specific, Measurable, Achievable, Relevant, and Time-bound. Your key performance indicators aren’t buried in a sea of metrics; they’re front and center. And for stakeholders who want more detail, we make the detailed metrics accessible with a click.
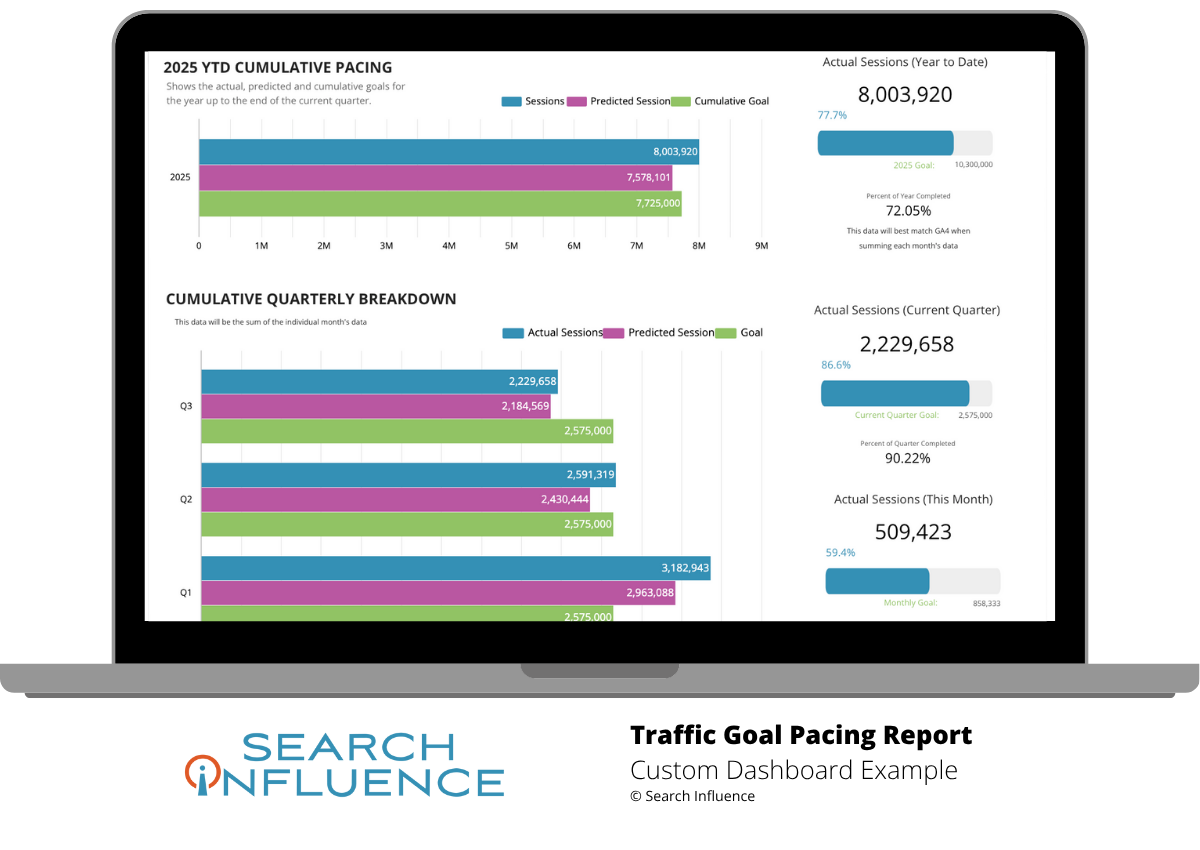
The Benefit: Everyone sees progress toward the same goals, whether it’s organic traffic growth, lead generation, or improved conversion funnel performance.
6. Customization for Your Business Model
The Problem: Off-the-shelf marketing dashboard templates limit what you can measure and how you can view it.
The SI Difference: Whether you’re in higher education tracking enrollment inquiries, healthcare tracking patient leads, or hospitality tracking bookings, we scope and build customizable dashboards tailored to your operations.
The Benefit: Your marketing data tells your story, not someone else’s template.
Search Influence’s Marketing Dashboard Best Practices
Our dashboards aren’t just pretty charts. They’re high-powered decision-making tools that would even make HAL gush.
Here’s what we prioritize:
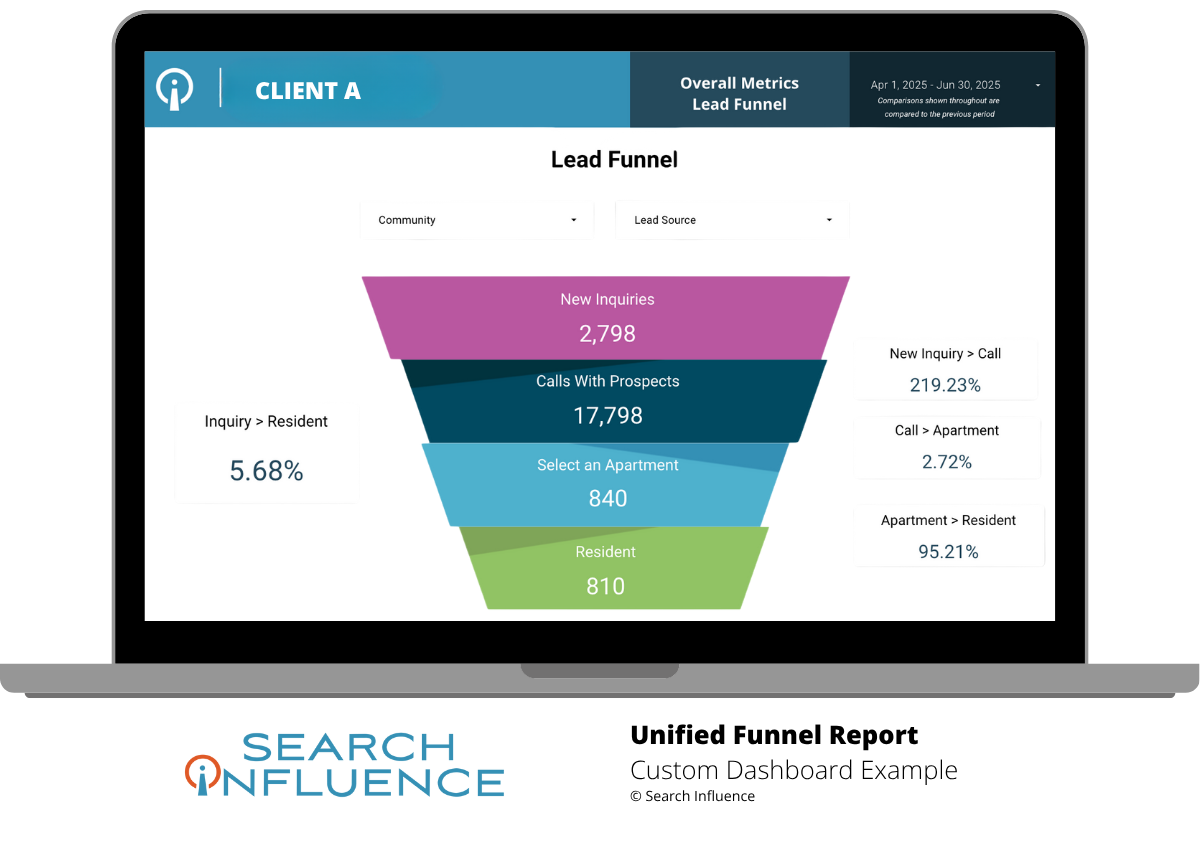
- Funnel visualization that shows your conversion funnel step by step
- Integration of all relevant data sources for complete marketing reporting
- Emphasis on lead quality, not vanity metrics
- KPI key metrics tracking aligned to SMART goals
- Custom configurations designed for your specific business
Marketing Dashboard FAQs
What does a marketing dashboard include?
A marketing dashboard includes metrics, visualizations, and KPIs that track marketing performance.
In practice, this means a dashboard isn’t just a list of numbers; it’s a carefully structured view of how your campaigns are performing across channels. A strong digital marketing dashboard example might combine website traffic, keyword rankings, and lead generation data into charts that reveal trends over time.
Instead of hunting through Google Analytics, Facebook Ads, and email campaign reports separately, you get one clear picture. Some dashboards even layer in benchmarks or targets, so your marketing teams can quickly see if campaign data is above or below expectations.
How to create a dashboard for marketing?
Creating a dashboard for marketing requires defining goals, selecting KPIs, and integrating data sources.
The process starts with your marketing strategy: What do you want to achieve?
If your goal is lead generation, your key performance indicators may include cost per lead, lead quality, and conversion funnel stages.
From there, you identify the data sources (Google Analytics, Google Ads, social media, CRM, etc.) and use a marketing dashboard tool to connect them. The best dashboards allow customization, so you can highlight priority metrics for executives while still offering detailed metrics for specialists.
Or, you could call Search Influence.
We scope dashboards that reflect both your goals and your business model, whether that’s patient inquiries, student applications, or e-commerce sales.
What are the three essential elements of a marketing dashboard?
A marketing dashboard has three essential elements: relevant KPIs, real-time data, and visual clarity.
Relevant KPIs ensure the dashboard focuses on the numbers that matter most, not vanity metrics. Real-time or near-real-time data makes sure decisions are based on current performance, not last quarter’s results.
And visual clarity means presenting complex data in a way that’s easy to interpret, through graphs, funnels, or tables. For example, a marketing KPI dashboard might display how organic traffic, paid advertising, and email campaigns each contribute to overall lead generation. Without all three elements, dashboards risk becoming confusing reports rather than tools for data-driven decisions.
What is a marketing dashboard used to do?
A marketing dashboard is used to monitor campaign performance, track ROI, and guide strategic decisions.
Think of it as a single source of truth for your marketing data. Instead of siloed reports, it consolidates insights into one analytics dashboard so you can evaluate the effectiveness of your digital marketing campaigns. Marketing dashboards typically show you where leads are coming from, how much they cost, and how they move through the conversion funnel.
Beyond reporting, they’re decision-making tools: Should you increase spend on Google Ads?
Should you shift resources from LinkedIn Ads to search engine optimization?
A well-built dashboard answers those questions with clarity.
What are marketing metrics?
Marketing metrics are measurable values that indicate the effectiveness of marketing efforts.
These include everything from social media metrics like engagement and reach, to SEO dashboards that track keyword rankings and organic traffic, to financial metrics like customer acquisition cost and revenue generated.
The key is to focus on the right mix of performance metrics that align with your goals. For example, a B2B business might prioritize cost per qualified lead, while a retail brand might zero in on website performance and conversion rate.
By tracking marketing metrics consistently, marketing professionals can see which channels deliver ROI and which need refinement.
How to measure marketing performance?
Measuring marketing performance involves tracking KPIs, comparing results to goals, and analyzing trends over time.
A web analytics dashboard tracks website performance and website traffic, while a social media dashboard pulls in data from platforms like LinkedIn Ads or social media ads.
But raw numbers aren’t enough.
The value comes from comparing outcomes to your SMART goals: Did organic traffic hit the growth target?
Did email campaigns generate the expected inquiries?
Did your company’s marketing efforts lower acquisition cost?
By tying performance metrics back to objectives, you gain actionable insights to optimize campaigns. Measuring performance this way isn’t just reporting; it’s steering your marketing strategy with confidence.
Why the SI Marketing Dashboard Difference Matters
Most dashboards give you half the picture. They skip over lead generation efforts, gloss over ROI, and bury key insights in complex data.
Search Influence dashboards give you the whole landscape with all its beautiful details, Ansel Adams style.
Whether you use our standard marketing dashboard or a fully custom build, you’ll see a clear, actionable view of your digital marketing campaigns. You’ll know how your marketing channels are working together, how your website’s search engine performance is trending, and where to focus resources for the biggest impact.
If you’re ready to go beyond surface-level reporting, it’s time to see what your marketing dashboard could really do.
Schedule a consultation and see how Search Influence dashboards turn data into decisions.