Common Google Analytics Terms Explained
April 5th, 2019 by
Google Analytics is a free service provided by our friends at Google that automatically collects and allows you to analyze data about your website visitors. Google Analytics is an essential tool for digital marketers, businesses, bloggers, and everyone in between with a website.
Google Analytics can help guide your decision-making processes and marketing strategies. You can figure out why your website visitors are bouncing, learn about the demographics of your audience, monitor progress towards your goals, and more.
With the plethora of information available in Google Analytics, it can be difficult to understand all of its dashboards and metrics.
Google Analytics Terms for Beginners
-
Users
- The number of people who viewed your website at least once within a given time period is represented by users.
-
Pageviews
- Pageviews is the number of times visitors to your site view a page. Every page visit is included in this number, including if someone refreshes the same page. Pageviews is a great metric to look at when you want to determine which pages are your website’s most popular.
-
Sessions
- Sessions are the individual periods of time someone visits your website. A session resets in increments of 30 minutes. A website visit ends when 30 minutes have passed. If a visitor leaves and returns to your site within 30 minutes, that counts as one session.
-
Bounce Rate
- Bounce rate is a number that is found by dividing the number of total bounces by total visits. This represents the percentage of people who visit one page on your website and then leave without going to any other pages. Bounce rates can be applied to an entire website or individual pages.
Dimensions
Dimensions are attributes of your Google Analytics data. Some examples of dimensions are the source/medium, which we’ll discuss later, or location. There are several options, including device category, language, and campaign. Dimensions are helpful for making sense of the data generated by different reports.
-
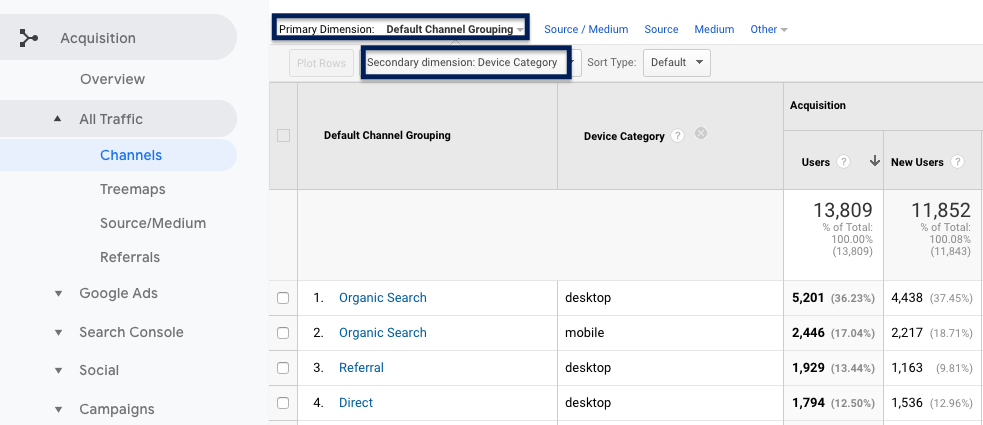
Primary dimension
- A primary dimension in Google Analytics is the first displayed attribute of your data, which differs depending on the report you’re looking at. For example, if you’re looking at Channel under Acquisition, the channels by which people used to visit your website is the primary dimension.
-
Secondary dimension
- A secondary dimension in Google Analytics allows you to add another layer to parse through your data. So, let’s say you wanted to know how many people visited your site through each channel and the device they used to get there, you can add “Device Category” as a secondary dimension to see the data sorted by the device.
Reviewing Acquisition Reports
If you’re curious about how people found your website, acquisition reports will tell you which sources visitors used to get there. The acquisition report shows the origin of the visit (like a search engine, a Facebook ad, or email marketing campaign) and the specific medium.
-
Channels
- Channels in Google Analytics provide a broad idea of where your website visitors came from. Analytics has a default channel grouping. This grouping consists of channels like Direct, Organic Search, Social, and Referral.
-
Organic Search Traffic
- An organic search visit is a visit that came from a search engine. If someone typed in your business name or keywords related to your business in Google and clicked on your website in the Search Engine results page, this counts as an organic website visit.
-
Direct Traffic
- Direct traffic is a result of a user typing in your exact web address in the address bar or clicking a bookmark in their browser.
-
Referral Traffic
- Referral traffic visits are a result of visitors getting to your site from another site on the web. If I were on Yelp browsing restaurants for dinner and came across a place I’d like to check out and then clicked a link to their website from their Yelp listing, this would show up in their Analytics as a referral visit. Reviewing referral traffic can be helpful for deciding if certain off-site tactics are worth the time and effort. For example, if you’re doing a lot of posting and promotion on Facebook and you see that your referral traffic has not increased, you may decide to spend less time on that strategy and focus elsewhere.
-
Source/Medium
- Source/medium provides a closer look at where your website visitors are coming from. Source identifies the referrer of a site visit. A source can be a search engine, an ad, a newsletter, etc. while the medium is the channel used. Examples of source/medium include the following:
-
-
- Google/organic – Google is the source, organic the medium.
- Google/CPC – Google again is the source, but the medium is a paid search ad.
- Yelp/Referral – Yelp is the source and a referral is the medium.
-
-
- Source/medium provides a closer look at where your website visitors are coming from. Source identifies the referrer of a site visit. A source can be a search engine, an ad, a newsletter, etc. while the medium is the channel used. Examples of source/medium include the following:

For Understanding User Behavior & Measuring Conversions
-
Landing Page/Exit Page
- A landing page is the page a user first sees when they visit your website, and an exit page is last one they browse before leaving.
-
Events
- Events are actions that a user takes on a website. Ideally, these should be created around your key performance indicators. For example, if you have a button on your website that allows users to check the rates of your B&B for a night’s stay, you can set up an event to know how many people clicked that button.
-
New vs. Returning Visitors
- Google Analytics allows you to divide your site traffic into new and returning visitors. New visitors are people who had not previously visited your website during the time period you’ve selected. Returning visitors have viewed your website more than once during that time frame.
-
Goals
- Goals are similar to events but are more focused on conversions. An example of a conversion is someone making a purchase or requesting a proposal from your company. Google Analytics provides 20 slots to track these.
Navigating Google Analytics and all of its reports can be difficult. Properly utilizing the tools within Google Analytics to inform your business decisions can be even more challenging, but we can help with that. At Search Influence, we love analytics and lead tracking. Give us a call at 504-881-1597 to learn how we can help you know where your customers are coming from.
Images