
Show Me An Infographic, Mister! New Orleans’ Unique Content Marketing Approach
May 19th, 2015 by
There’s definitely a story behind New Orleans—the city of festivals. And it’s an insider story you likely haven’t seen online before. For example, what New Orleans tradition includes 822 floats and is 21,000 riders strong? What celebration features more than 130 pyramids of burning logs? When it comes to content marketing, New Orleans gives tourists and locals alike reasons to share the kind of fun, behind-the-scenes information that makes the Big Easy one of the world’s most fascinating cities. In a city steeped with so much history and culture, infographics are helping to bring some of the key celebrations—such as the recent New Orleans Jazz & Heritage Festival and Mardi Gras—to life through visual storytelling.
A City of Festivals Comes to Life
The New Orleans Tourism Marketing Corporation enlisted the help of Search Influence and its creative infographics team to reinforce the city as a year-round destination where there’s always something happening. Yes, it’s true: there’s virtually always a parade, festival, second line, or other event every week. And along with the big-name festivals like the New Orleans Jazz & Heritage Festival, French Quarter Fest, Essence Music Fest and Voodoo Festival, there are many other celebrations that lend to the city’s reputation for being among the most diverse festival cities in the world.
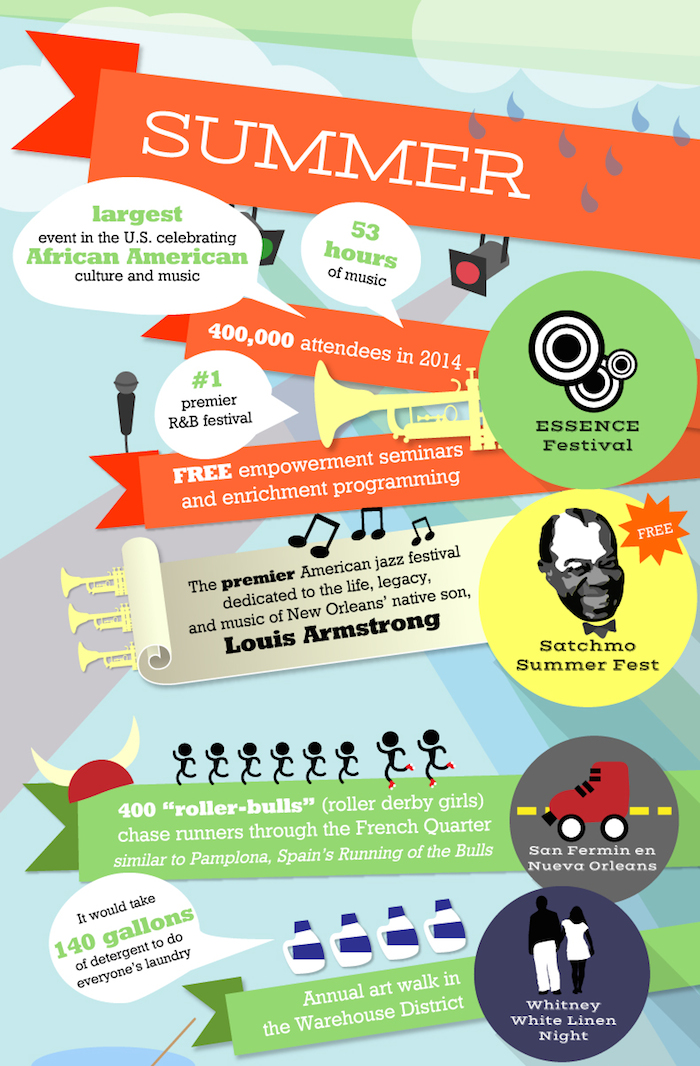
In fact, New Orleans is deep in its festival season now, and this infographic gives the story in eye-catching detail—in a way that just plain old written content can’t match. Check out the part that describes summer festivals in New Orleans:
See the Magic of Legendary Mardi Gras
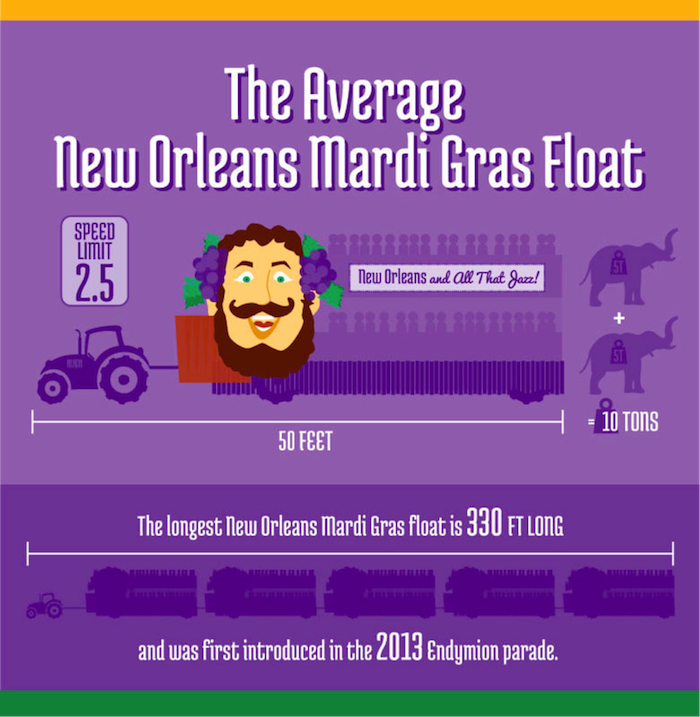
This February, another Search Influence-produced infographic detailing the legendary New Orleans Carnival—a tradition that dates back to the city’s first Mardi Gras parade in 1837—helped bring renewed interest among people that visited the official New Orleans tourism guide website. While visitors to the website typically spend an average of two minutes browsing, visitors to the Mardi Gras infographic page were spending upwards of eight minutes reading the content. On social media, the infographic was shared more than 700 times on Facebook and Twitter. In fact, the infographic received 6,000 views in its first week. Here’s a glimpse of part of the infographic:
What Makes a Good Infographic?
While content marketing is certainly taking off in New Orleans with lots of local flavor mixed in, all businesses—no Jazz Fest or Mardi Gras required—can learn infographic best practices from these New Orleans examples.
When crafting an infographic, follow these four tips:
- Include impressive or interesting statistics that draw readers’ engagement. For example, the average Mardi Gras float in New Orleans is 50 feet long and weighs 10 tons—the weight of two elephants!
- Make sure the infographic is very graphics heavy. Include images and charts to show your audience the story. That streetcar with “Stellaaaaa” amplified by a megaphone really illustrates the best-loved play that pays tribute to one event: the Tennessee Williams New Orleans Literary Festival.
- Include an element of usefulness. For example, with more than 70 different parades during the Carnival Season, it can be hard to keep track and determine which ones to attend. For example, the handy “Noteworthy Parades” section of the Mardi Gras infographic doubles as a useful calendar, and the key to the festivals infographic, for example, is to showcase the festival—or multiple festivals!—for every season theme.
- To finish, craft all of your data and graphics into a visually appealing design. The Mardi Gras infographic, for example, makes use of the vibrant and traditional purple, green, and gold colors as well as a few bold fonts to form an appealing connection between all of the information.
With these tips on creating the best infographic, keep in mind that the goal with this graphical content is typically to generate website traffic, backlinks, and social shares. And with Facebook and other social media sites putting more and more focus on visual content, it is a safe bet that infographics are not dead. In fact, these Big Easy examples demonstrate further that infographics should be a part of a company’s content marketing strategy.
You know I love this!