66 Higher Education Marketing Stats [2025]
July 7th, 2025 by
This post was updated by Paula French on 7/7/2025 to reflect current best practices. It was originally published on 1/9/2025.
Higher education marketers face more pressure to compete than ever before. From the demographic cliff and evolving modern learner to the increasingly saturated market, institutions must pay close attention to how they measure up to the industry to stay ahead.
These 66 stats, drawn primarily from our continuing and online education research with UPCEA, reveal how institutions approach digital marketing, tracking performance, and reaching prospective students. See what’s working, what’s missing, and where to focus your next efforts for greater success.
Must-Know Higher Education Marketing Stats for 2025
Cost Metric & Benchmark Statistics
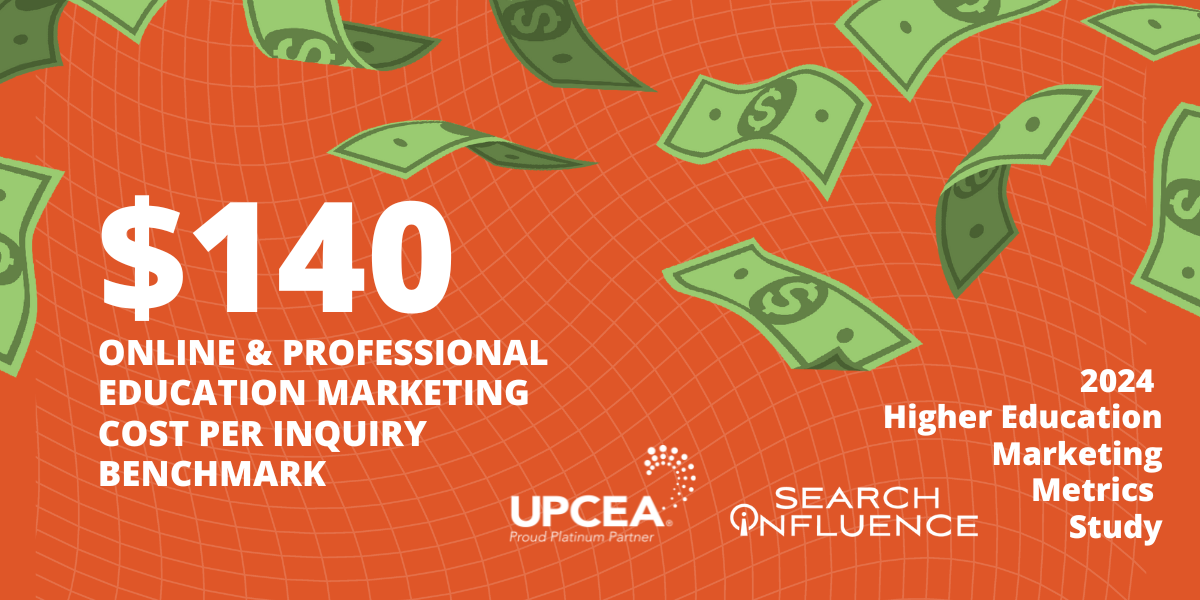
Digital advertising cost per inquiry benchmarks
- $140: Average cost per inquiry in higher ed (online and continuing education)
- $157: Average cost per inquiry for graduate programs
- $128: Average cost per inquiry for undergraduate programs
- $51: Average cost per inquiry for non-credit courses
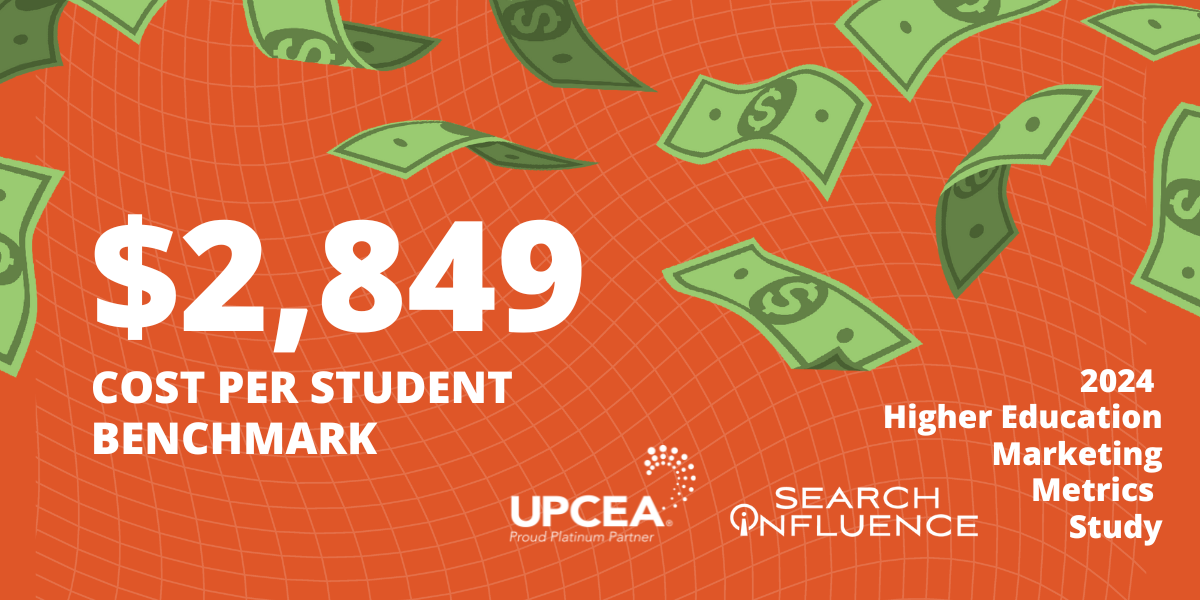
Cost per enrolled student benchmarks
- $2,849: Average cost per student in higher ed (online and continuing education)
- $3,804: Average cost per student for graduate programs
- $1,505: Average cost per student for undergraduate programs
- $599: Average cost per student for non-credit courses
Marketer spend & satisfaction stats
- The average annual digital ad spend is $800,970, accounting for 3.6% of total revenue.
- 47% of higher ed marketers are satisfied with their marketing campaign performance.
- 38% of higher ed marketers are satisfied with their cost per inquiry.
- 27% of higher ed marketers are uncertain about their satisfaction with their cost per inquiry.
- 29% of higher ed marketers are satisfied with their ability to track their campaign success.
- 92% of those satisfied with their tracking capabilities also report satisfaction with their marketing campaign performance.
Source: Search Influence x UCPEA
Marketers’ SEO Capability & Strategy Statistics
H4 – SEO prioritization & awareness stats
- 82% of higher ed marketers view digital marketing as a core part of their marketing strategy.
- 84% of higher ed marketers view SEO as a core part of their marketing efforts.
- 51% of higher ed marketers do not have an established SEO strategy.
- 52% of higher ed marketers are highly aware of their continuing and online education unit’s SEO capabilities, processes, and strategies.
SEO execution & resourcing stats
- 91% of higher ed marketers implement paid search into their SEO strategy.
- 27% of higher ed marketers integrate keyword optimization and link-building into their SEO strategy.
- 55% of higher ed marketers allocate marketing spend to every graduate program in their portfolio.
- 15% of higher ed marketers allocate funds equally across programs.
SEO ownership model stats
- 36% of higher ed marketers say SEO for their online and continuing education programs is handled entirely by the marketing or continuing ed unit.
- 23% of higher ed marketers say their SEO is split evenly between in-house teams and outsourcing.
- 18% of higher ed marketers say their SEO is mostly handled in-house, with some outsourcing support.
- 18% of higher ed marketers say their SEO is mostly outsourced, with some help from in-house teams.
SEO strategy leadership stats
- 36% of higher ed marketers say their SEO strategy is mostly led by the continuing and online education unit, with some input from the college or university.
- 27% of higher ed marketers say their SEO strategy is exclusively led by the continuing and online education unit.
- 18% of higher ed marketers say their SEO strategy is mostly led by the college or university, with some input from the continuing and online education unit.
- 18% of higher ed marketers say their SEO strategy is evenly led by the college or university and the continuing and online education unit.
SEO web content & collaboration stats
- 36% of higher ed marketers say their marketing team doesn’t involve faculty or staff in SEO keyword selection.
- 92% of institutions strategically highlight degree, program, and/or course information in their website design.
- 78% of institutions strategically use title tags and meta descriptions in their website design.
- 70% of institutions strategically use images and image optimizations in their website design.
- 20% of higher ed marketers don’t have a plan for developing and updating their website content.
SEO strategy review cadence stats
- 50% of higher ed marketers say their unit revisits their SEO strategy every quarter.
- 18% of higher ed marketers say their unit revisits their SEO strategy once every six months.
- 14% of higher ed marketers say their unit revisits their SEO strategy once a year.
- 5% of higher ed marketers say their unit revisits their SEO strategy once every few years.
Marketing Tracking & Reporting Statistics
Lead tracking & attribution stats
- Less than 60% of higher ed marketers have insight into how leads perform after moving from marketing to enrollment efforts.
- 31% of marketing departments struggle to correlate their marketing success with enrollment numbers.
Cost tracking stats
- 46% of higher ed marketers track cost per inquiry.
- 43% of higher ed marketers track cost per enrolled student.
Website performance & traffic tracking stats
- 93% of higher ed marketers track their programs’ web traffic.
- 89% of higher ed marketers track their programs’ source of traffic.
- 85% of higher ed marketers track their programs’ organic visits.
- 70% of higher ed marketers track time spent on pages.
- 69% of higher ed marketers track bounce rates.
SEO reporting expectations & gaps stats
- 62% of university leaders want consistent reporting on SEO.
- 31% of university leaders receive the regular SEO reports they want.
Reporting frequency stats
- 33% of higher ed marketers report on metrics once a month.
- 24% of higher ed marketers report on metrics once a quarter.
- 8% of higher ed marketers report on metrics once every six months.
- 10% of higher ed marketers report on metrics once a year.
Sources: Search Influence x UPCEA, Ruffalo Noel Levitz, Search Influence x UCPEA
Prospect Behavior & Outlook Statistics
Search engine usage for program discoverability stats
- 67% of Internet users turn to search engines as their first source of information when researching higher education institutions.
- 64.6% of Internet users click on sponsored links when researching higher education information.
- More than 90% of prospective students visit an institution’s website in their search for higher education programs.
Online learner stats
- 73% of online learners are pursuing degrees.
- 27% of online learners are pursuing credit-bearing certificates or licensure programs.
- 58% of online learners are employed full-time.
- 21% of online learners are employed part-time.
- 26% of online learners choose a school based on how well its programs align with their career goals.
- 32% of online learners cite time to completion as a key enrollment factor.
Adult learner stats
- Adult learners account for 42% of higher education revenue.
- The total addressable market of adult learner candidates is estimated to be 242+ million.
- Gen Z is predicted to comprise 60% of all adult learners by 2031.
Sources: tSunela, Education Dynamics, EAB, UPCEA
Higher Education Marketing Statistics and Benchmarks FAQs
How is the traditional higher education student evolving in 2025?
The higher education sector is approaching a “demographic cliff,” with a sharp decline in traditional 18-22-year-old students expected over the next two decades. This anticipated decline presents an opportunity to market to a growing population of adult learners, aged 25+. Recent data estimates the total addressable market of adult learner candidates at 242+ million.
These “modern learners” may be entering college for the first time or returning to school to finish a degree. Because they are often employed part or full-time, they tend to value flexibility and distance-learning programs to accommodate a busier schedule.
How centralized are marketing decisions across different departments and the greater institution?
36% of higher ed marketers report that their continuing and online education unit leads the SEO strategy, with some input from the college or university. Another 27% say their continuing and online education unit manages it entirely. Meanwhile, 18% report that the college or university leads the strategy with some input from the continuing and online education unit, and another 18% say both share the responsibility equally.
What percentage of higher education marketers have an established SEO strategy?
Although 84% of higher ed marketers view SEO as a core part of their marketing strategy, only 47% have an established SEO strategy. Higher education SEO marketing statistics reveal that the other 2% are unsure.
What are the most common SEO metrics universities track?
Online and continuing education marketers primarily track web traffic (93%) for their programs, followed by traffic sources (89%), organic visits (85%), page time (70%), and bounce rates (69%).
How important is SEO reporting to higher education leaders/administrators?
While 62% of university leaders want consistent reporting on SEO, only 31% receive regular updates. 33% of higher ed marketers report on metrics monthly, 24% quarterly, 8% every six months, and 10% annually.
How often do higher education marketers reassess their SEO strategies?
50% of higher ed marketers say their unit reviews the SEO strategy and execution for their continuing and online education programs quarterly. 18% reassess their strategy every six months, 14% annually, and 5% every few years.
How many universities track cost per inquiry and cost per enrolled student?
Despite being a key indicator of advertising efficiency, less than half of higher ed marketers track cost per inquiry (46%) and cost per enrolled student (43%).
What is the benchmark for higher education cost per inquiry and cost per enrolled student?
On average, higher education marketers for online and continuing education programs spend $140 to generate each inquiry and $2,849 to enroll each student.
How many higher education marketers are satisfied with the performance of their marketing campaigns?
47% of higher ed marketers express satisfaction with their marketing campaign performance.
How does campaign tracking satisfaction correlate with performance satisfaction?
92% of higher ed marketers who are satisfied with their analytic tracking capabilities also express satisfaction with the performance of their marketing campaigns.
See More Digital Marketing and SEO Data for Higher Education
These higher education marketing benchmarks and data figures help you temperature-check the state of your own marketing strategies. Use them to gauge your performance, inform your core focuses, and ultimately set the stage for enrollment success.

For deeper insights into the data from our Search Influence x UPCEA research, download our full SEO Research Study and Marketing Metrics Research Study today.